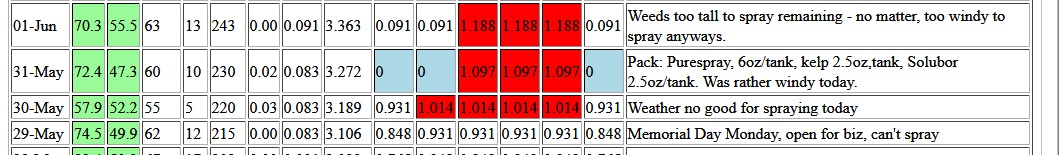
The first column is date, followed by the high and low temperatures that day. The light-green background indicates that this value was sufficient for PMI growth.
Next are the mean temperature that day, followed by the GDD for that day, followed by the cumulative GDD for the year at that point.
Next is the rainfall for that day. this will have a red background if the rainfall exceeds 0.10 which would mandate a fresh spraying.
Next comes the computed Powdery Mildew Index (PMI) for that day. This is derived from a mathematical model from UCDavis, details are available on the website. The next column indicates the cumulative PMI since the start of the growing season, or the previous spraying. When this number exceeds 1.0, it's time for your next spray. You can choose to have the system send a txt or email when this happens.
The remaining six columns represent each of the six blocks in this vineyard. (You configure however many you wish.) The light-blue background indicates that the block was sprayed that day, and the count resets to zero. You'll see that spraying was done a day late (PMI>1.0), but there's a comment explaining that the weather was not conducive to spraying that day.
Three of the six blocks were sprayed on 31-May, the remaining were sprayed a few days late, but it's not shown in this screenshot.